This article has been translated into العربية, বাংলা, Català, Dansk, Deutsch, Ελληνικά, Español, فارسی, Suomi, Français, हिन्दी, Magyar, Italiano, 日本語, 한국어, Mакедонски, Bahasa Melayu, Polski, Slovenščina, தமிழ் and 汉语.
COVID-19 HGI Results for Data Freeze 4 (October 2020)
November 24, 2020
Written by Jamal Nasir, Brooke Wolford, and Kumar Veerapen on behalf of the COVID-19 HGI
Edited by Emi Harry, Atanu Kumar Dutta, and Rachel Liao
Note: The COVID-19 Host Genetics Initiative (HGI) represents a consortium of over 1000 scientists from over 54 countries working collaboratively to share data, ideas, recruit patients and disseminate our findings. For a primer on our study design or the results from the July 2020 (data freeze 3), please read our inaugural blog post. Our research is iterative, and we summarize our new results via blog posts and on the results section of our website. Finally, if any vocabulary here is unfamiliar, please send us an email at hgi-faq@icda.bio—we’d be happy to update the information here to provide more clarity. In the coming weeks, additional information explaining concepts or terminology will be made available. In the interim, take a look at this resource to review the basics of genetics.
COVID-19 Host Genetics Initiative adds additional samples, identifies robust genetic regions implicated in COVID-19 severity
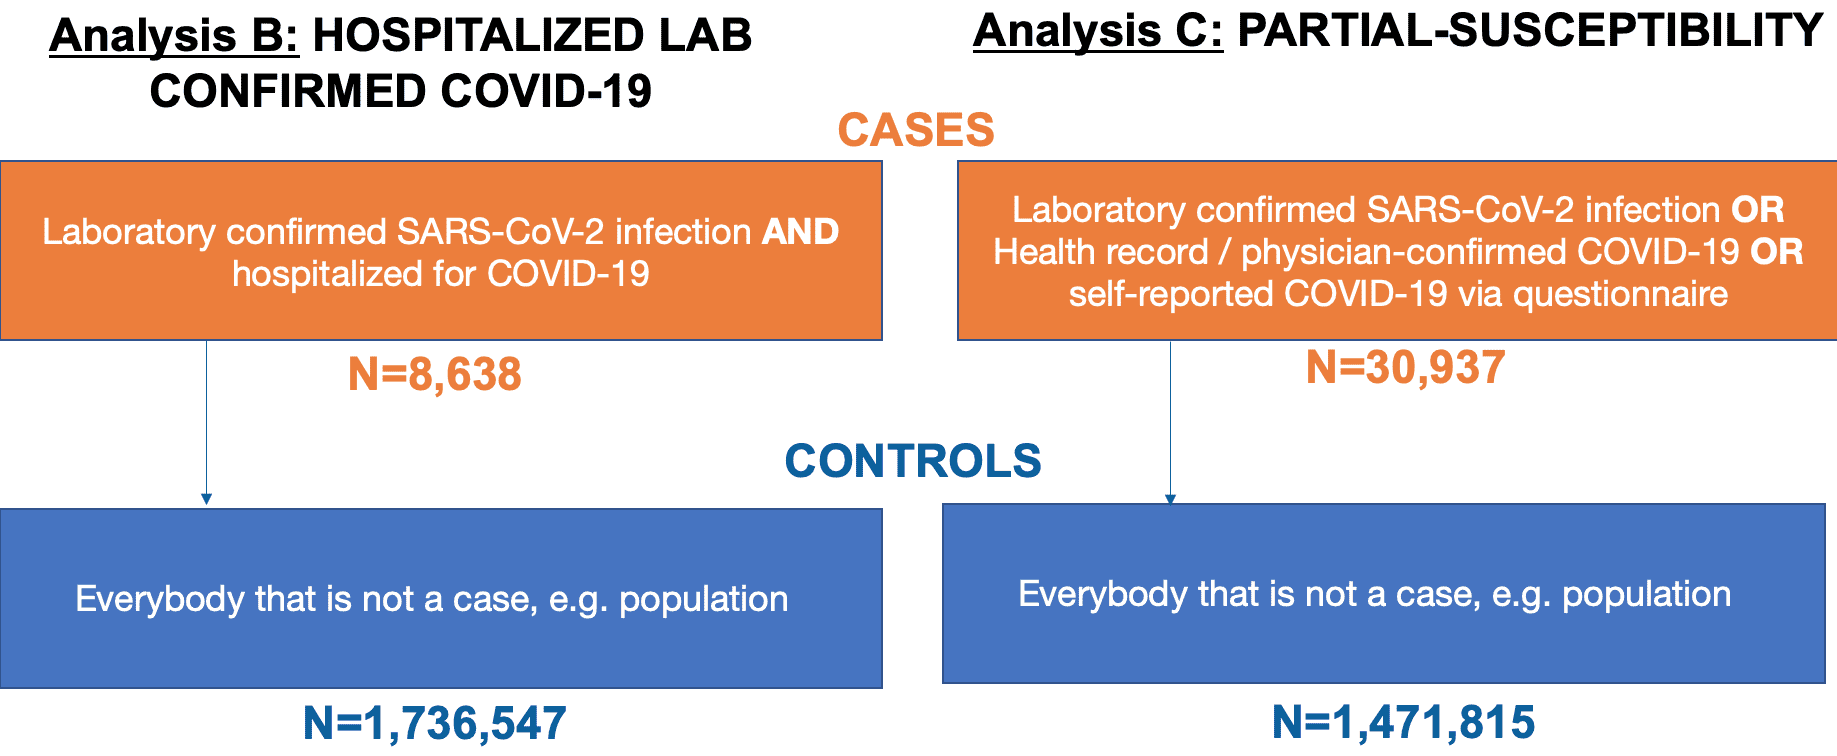
In July 2020, we reported the identification of human genetic variations that were associated with severe COVID-19 (select the tab for Release 3 results here) and the product of a Genome Wide Association Study (GWAS) on 3,199 COVID-19 patients (e.g., cases) and 897,488 controls (see our lay person blog post for more information). Since then, we have increased our cases by nearly ten-fold to over 30,000 COVID-19 cases and 1.47 million controls by combining data from 34 studies across 16 countries. A list of partners can be found here. The breakdown of our dataset is as seen in Figure 1.
Figure 1: Definition of cases and controls for each of the analysis conducted in our research. To note, SARS-CoV-2 is the virus that causes the COVID-19 infection. Adapted from Andrea Ganna’s presentation on the COVID-19 HGI at the American Society of Human Genetics Meeting in October 2020
What results changed from increasing the sample size? We have now provided robust evidence for seven genomic regions associated with severe COVID-19 (Figure 2), on chromosomes 3, 6, 9, 12, 19, and 21; and one additional signal on chromosome 3 associated with COVID-19 partial-susceptibility (Figure 3). We believe that our significant findings were the result of high-quality data from our global contributors. Many of these regions were identified by the Genetics of Mortality in Critical Care (GenOMICC) study (Pairo-Castineira et al) which allowed doubling of our number of cases, specifically in COVID-19 patients who were critically ill and hospitalized.
New findings implicate immunity and lung function as possible contributors to developing severe COVID-19
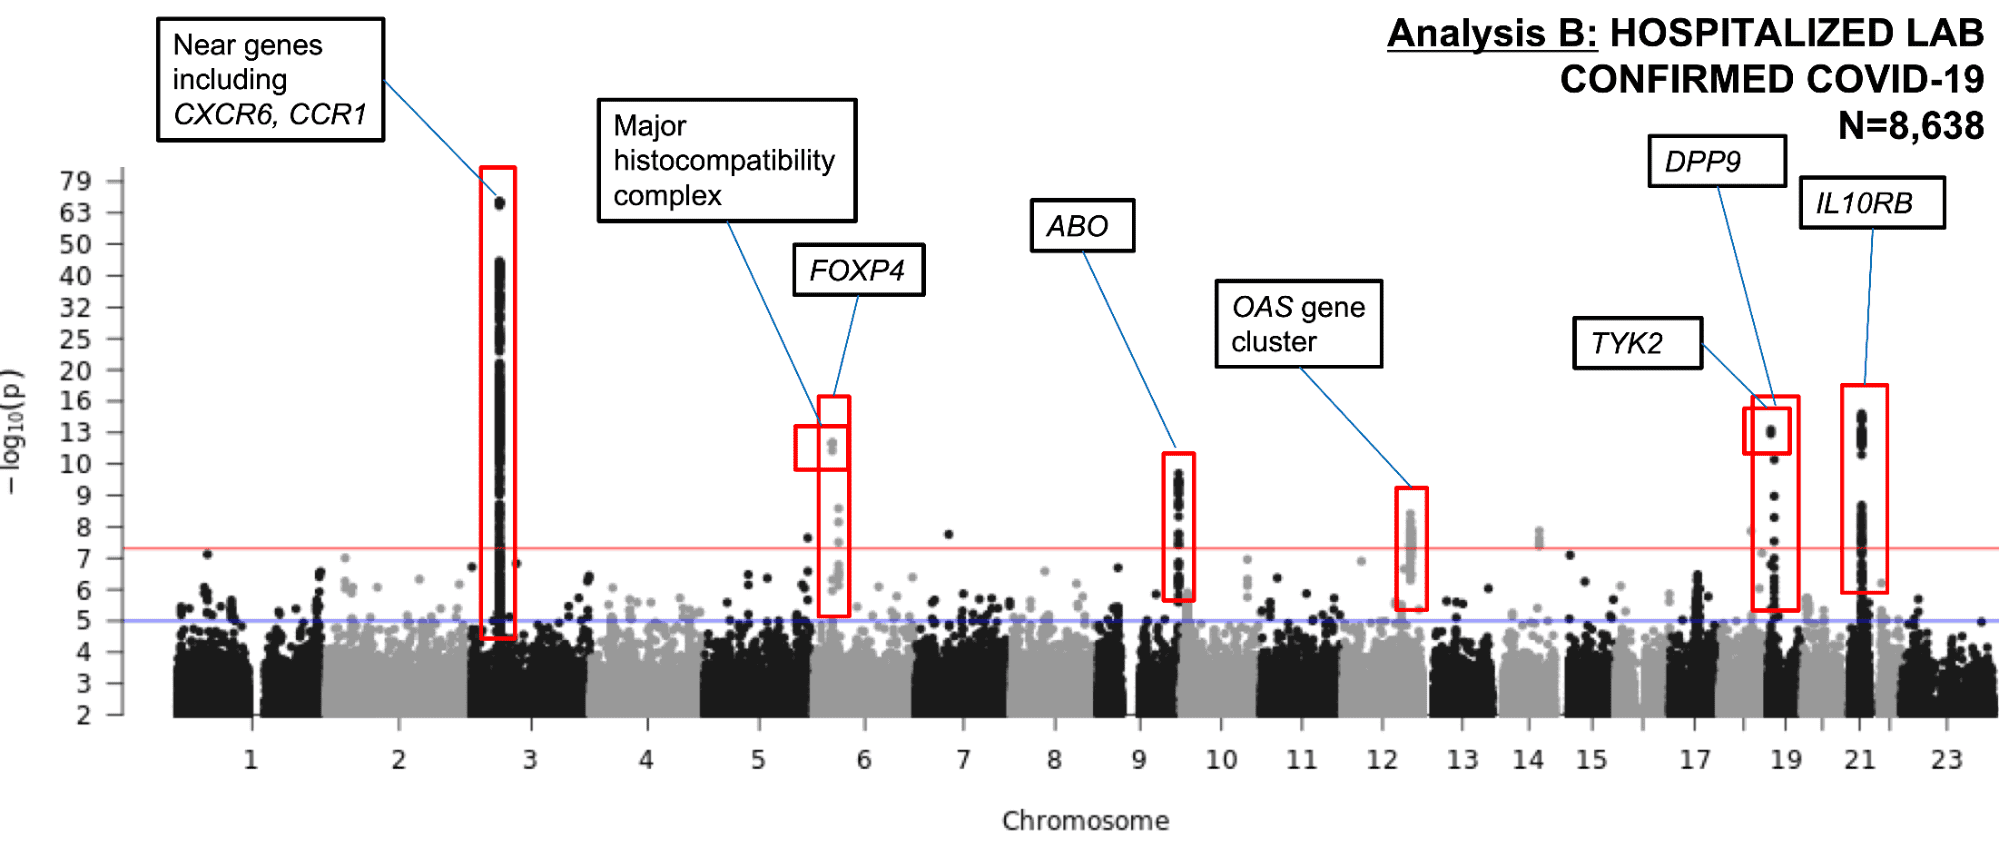
The latest GWAS robustly identified regions in seven different chromosomal regions that strengthened the evidence that COVID-19 severity could be attributed to disruption in the immune system. We ran an analysis to associate chromosomal regions with patients experiencing severe COVID-19 symptoms (i.e., hospitalized patients). We successfully identified regions on chromosomes 3, 6, 9, 12, 19, and 21 (Figure 2) harboring genes which regulate immunity or play a role in lung diseases. What do each of these chromosomal regions mean?
Figure 2. A Manhattan plot showing the GWAS results for COVID-19 Severity in 8,638 hospitalized COVID-19 cases and 1.7 million controls. The analysis identified independent significant associations as indicated by red boxes around genetic “peaks” rising above the red horizontal line which represents the predetermined statistical p-value threshold. This is in addition to our previously reported association on chromosome 3. The loci are labelled by the nearby gene(s) with potential biological significance. See the footnote of our first blog post for an explanation of this data visualization.
Chromosome 3
We replicated previous findings from July 2020, where we identified an association between genetic variants on chromosome 3 and COVID-19 severity and partial-susceptibility. (This region has also been reported in other recent studies including Ellinghaus et al, Shelton et al, Pairo-Castineira et al, and Roberts et al.) This region of chromosome 3 is close to several well-known immune-related genes for chemokine receptors, including CXCR6, CCR1, CCR3, and CCR9.
Chromosome 6
We identified genetic variants in a region closest to the FOXP4 gene (on chromosome 6) which plays a role in lung cancer development. Of note, the genetic variants that are associated with COVID-19 severity in our study have a higher frequency in some populations than others. Geneticists use frequencies of genetic variants to infer potential effects of these variants on a given trait or disease. The more rare a variant is, the more likely that this variant may confer risk to a trait or disease. The variant identified close to FOXP4 is considered rare in Europeans, where it appears in 1% of the population. However, it appears more frequently in East-Asian (39%) and Hispanic/Latino (18%) populations, so we do not yet understand the effect this may have on COVID-19 severity.
Additionally, we identified a second independent region on chromosome 6 in the major histocompatibility complex (MHC), a region containing genes that make important immune system proteins. However, the effect conferred from this region was very different across studies and we are not sure if this signal is specific to a certain patient population.
Chromosome 9
You may have learned from the news about a certain blood type being associated with COVID-19: blood type A conferring a higher risk and type O being protective. This was published in the New England Journal of Medicine and a preprint of the 23andMe study. In our first blog post, we reported that the COVID-19 HGI did not identify a region on chromosome 9 called the ABO blood group region. Now, with the doubling of our sample size, we do observe a protective genetic association in this region. However, similar to the MHC association observed on chromosome 6, this association was very different across studies and we are not sure if this signal is specific to a certain patient population.
Chromosome 12
On chromosome 12, we identified associations close to the OAS gene cluster which encode for antiviral restriction enzyme activators which function as a protective mechanism against viruses. The particular genetic variants in this region have been previously shown to be associated with chronic lymphocytic leukemia with a protective effect.
Chromosome 19
We identified two regions on chromosome 19. The first is near DPP9, a gene that is known to be involved in increased risk for lung fibrosis. Intriguingly, the protein DPP9 is closely related to DPP4, which is the protein that impacts another coronavirus’ ability to enter human cells—the virus which causes Middle East Respiratory Syndrome (MERS).
The second genomic region identified on chromosome 19 includes a genetic variant that is close to the gene TYK2. Variants in the TYK2 gene have been previously observed in patients with primary immunodeficiency syndromes—conditions where an individual has an impaired response to immune-system stimulation and increased susceptibility to viral infections.
One well known genetic variation in TYK2 is associated with a decreased risk of multiple autoimmune conditions (e.g. lupus and rheumatoid arthritis) in people who have this variant (not all variants are bad and this one is protective from the trait). This same TYK2 variant is significantly associated with severe COVID-19 in our study, however it is associated with an increased risk for COVID-19 severity. Although existing treatments for autoimmune diseases that target TYK2 could be repurposed to treat COVID-19, more research is needed because the genetic variant in TYK2 has an opposite effect between autoimmune diseases (protective) and COVID-19 (risk).
Chromosome 21
Finally, the association on chromosome 21 is near the genes IFNAR2 and IL10RB. We note that this signal is rather interesting because the IFNAR2 gene encodes for a subunit of an immunological molecule called an interferon receptor which is important for antiviral immunity. Clinical trials are ongoing for the use of interferons as a treatment for patients in the early course of COVID-19 infections, but much is still unknown. Interestingly, we also found that the genetic variant associated with severe COVID-19 patients was more significantly observed in females compared to males. As such, we are improving our sample collection across contributing partners to include the interrogation of sex-biases in genetic associations with hospitalized COVID-19 patients.
An additional region on chromosome 3 is associated with COVID-19 partial-susceptibility
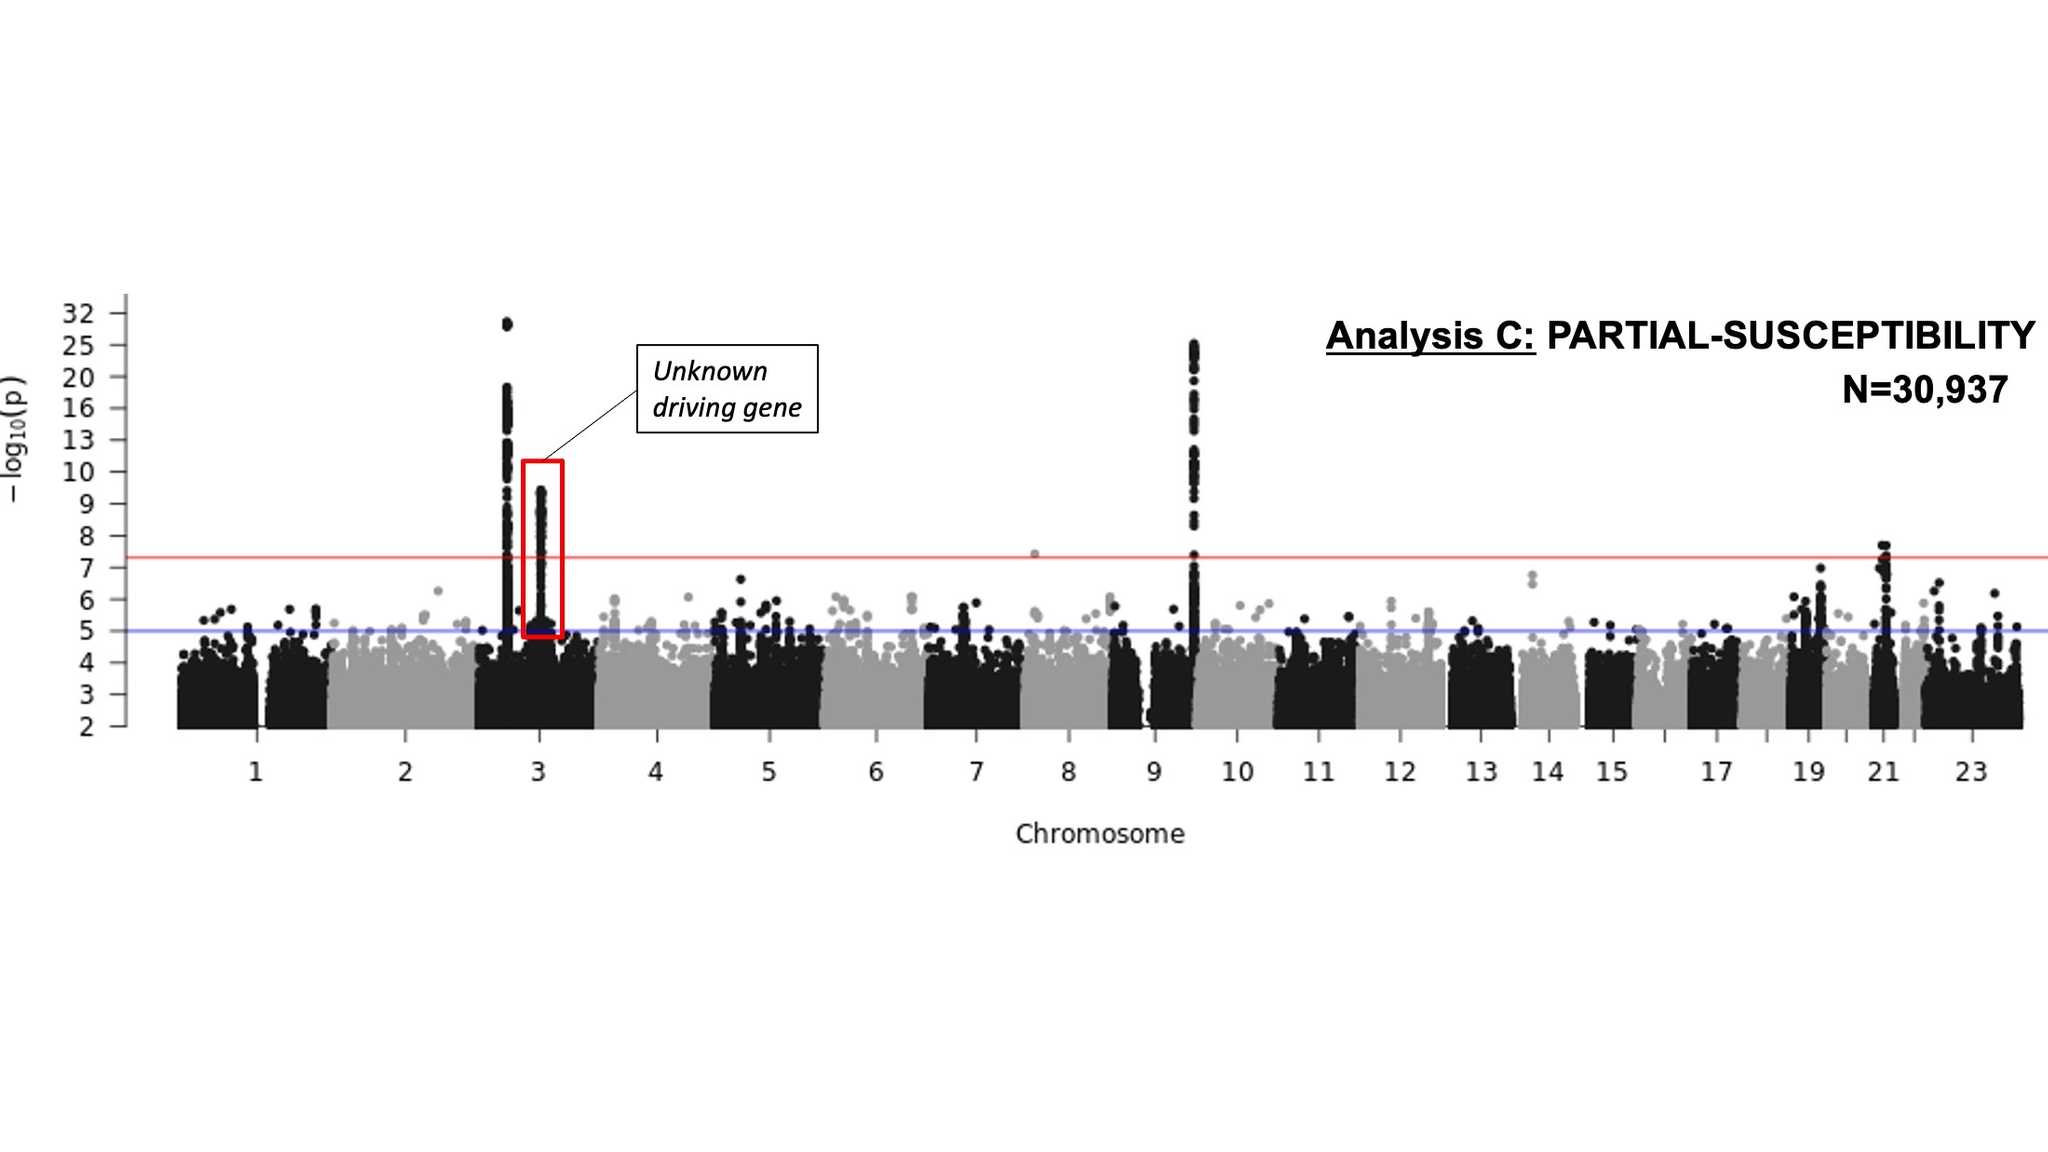
The COVID-19 HGI also ran an analysis to associate chromosomal regions with patients with a partial-susceptibility to COVID-19 (i.e., patients with positive COVID-19 tests that were not hospitalized). We identified regions on chromosomes 3, 9, and 21 (Figure 3). Most of these regions overlap those identified in our COVID-19 severity analysis (Figure 2). But we also identified a region on chromosome 3 that contains multiple genes, and we aren’t sure which may be driving this association (red box in Figure 3).
Figure 3. A Manhattan plot showing the GWAS results for COVID-19 partial-susceptibility in 30,937 COVID-19 cases and 1.5 million controls. The analysis identified one independent significant association to COVID-19 partial-susceptibility (indicated by red box around genetic “peaks” rising above the red horizontal line representing the predetermined statistical p-value threshold) in addition to regions also associated with COVID-19 severity on chromosome 3, 9, and 21. See the footnote of our first blog post for an explanation of this data visualization.
Our next steps
We are excited to report that our latest findings further explain the potential genetic etiology for the development of severe COVID-19. However, it’s important to keep in mind that while GWAS helps us identify these regions, more research is needed to determine the true causal genes in these regions and the biological mechanisms involved in disease severity.
Consistent with other studies, our latest results provide additional evidence that human genetic variation may impact the development of severe COVID-19, possibly through influencing the immune response in a person infected by SARS-CoV-2. Several teams of scientists are using these GWAS results for follow-up analyses to uncover the biochemical pathways involved in severe COVID-19. These may provide clues towards understanding disease progression and therefore adding to the clinical understanding and management of patients. Ongoing follow up analyses also aid in identifying the single causal gene when an associated region has many genes, like on chromosome 3, and identify which tissues are potentially affected by these genetic variants (for more, read this recent scientist-geared blog post).
As illustrated by the increase of cases from July to October, we are continuously expanding our study. At the next data freeze in December 2020, we will repeat our analysis with an increased sample size which will hopefully replicate our findings in this post and potentially identify new genetic variants associated with COVID-19. In addition, we are refining how we define cases and controls for future analysis. Through these additional genetic studies we are hopeful we can improve the understanding of how genetic variation influences COVID-19 severity and partial-susceptibility.
Acknowledgements
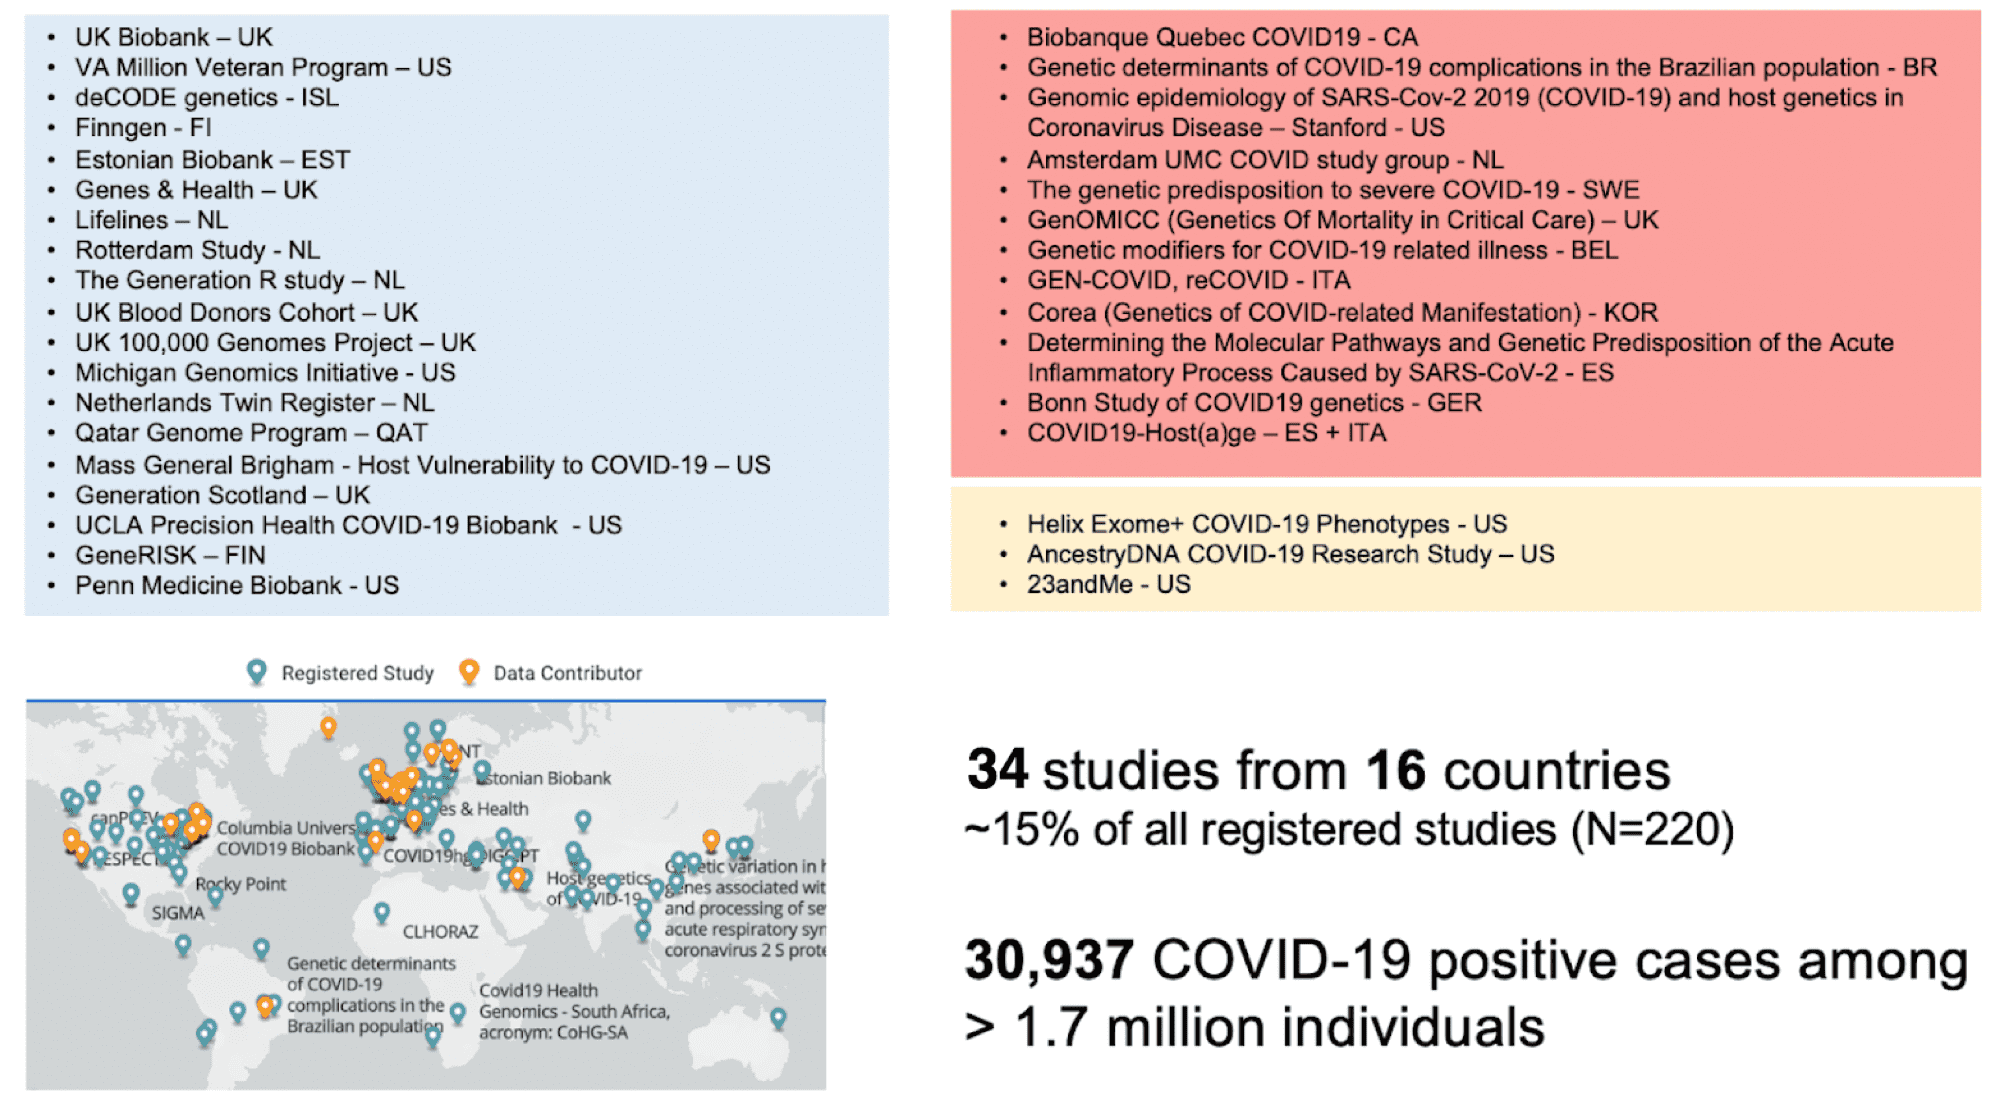
Thank you to Shea Andrews and Andrea Ganna for thoughtful feedback and revisions. We would especially like to acknowledge all the studies that contributed to the results from our study (Figure 4).
Figure 4: List of partners that contributed to COVID-19 HGI. Adapted from Andrea Ganna’s presentation on the COVID-19 HGI at the American Society of Human Genetics Meeting in October 2020.


